SIMOGGA suite
SIMOGGA Analytics
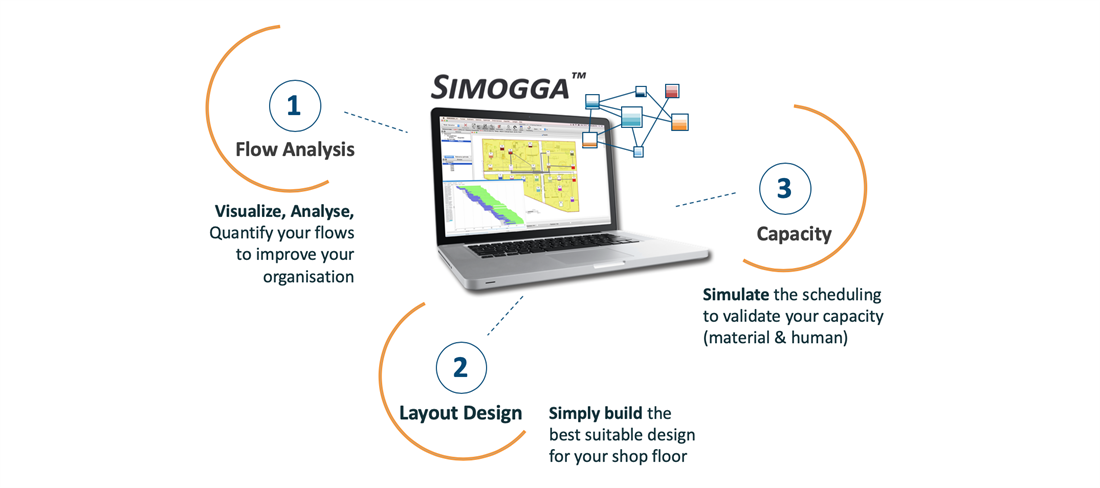
A visual simulator to analyze your data, give a visual representation and guide you to optimize the warehouse.
Warehouse optimisation
Turn warehouse data into a picture the whole team can act on
SIMOGGA Analytics is dedicated to warehouses. It uses data from the WMS or ERP and transforms large amounts of picking, product and location data into a visual representation. Complex analysis becomes a shared discussion rather than a spreadsheet exercise.
The model covers the layout, stock locations, picking strategies, travel distances and the arduousness of each route. Scenarios can be simulated before a new picking strategy or product location is implemented.
- Decrease arduousness by 20 to 70%
- Decrease analysis management time by 50 to 75%
- Improve flexibility and operational agility
- Increase the efficiency of each actor
- Analyse congestion with heat maps and product rotation
- Quantify the benefit of improvement suggestions
What it is built for
Analytics for warehouse teams
The tool supports Lean, logistics, strategy and business control with a shared view of warehouse performance.
Congestion and heat map
See where flows concentrate and remove the aisles or locations that create friction.
Product rotation
Identify products and rows with low, medium or high rotation and adjust locations accordingly.
Picking strategy simulation
Compare strategies and quantify travel, time and resource impact before implementation.
Product detail
Features, process and system requirements
Functions
Analysis and results
- Create a layout with thousands of stock locations from templates.
- Create filters by product, machine, operator and product family.
- Simplify flow analysis with filters that reduce complexity.
- Analyse aisle congestion and remove it by changing the layout.
- Create product families through product flow analysis, ROC and similarities.
- Identify locations with low, medium or high rotation.
- Highlight rows that concentrate the best improvement potential.
- Quantify the human resources required to reach the goals.
Process
- The customer extracts data from the ERP or WMS into an Excel sheet that is transformed into an XML file.
- Data can be collected or changed directly in the SIMOGGA interface.
- The layout is built in the Layout view to define storage areas and product locations.
- Data reliability is validated through the visual view of flows and storage.
- Historical picking data is used to create the As Is situation and analyse current KPIs.
- The As Is view provides flow analysis and an evaluation of arduousness, kilometres and efficiency.
- The simulator computes transport time from the layout to extract real picking time by zone and worker.
- Scenarios are simulated for product location, layout, picking strategy, demand or investment.
- Improvements are spread over time and updated with new field data.
System requirements
SIMOGGA is based on the Qt framework and has been tested on the following platforms:
- Microsoft Windows 10, x86 32 and x64
- Microsoft Windows 8.1, x86 32 and x64
- Microsoft Windows 7 SP1, x86 32 and x64
- Microsoft Windows Vista SP2, x86 32 and x64
- Apple Mac OS X 10.9 Maverick or later, Universal
Other platforms may work but full compatibility cannot be guaranteed. Installation requires 300 MB of free disk space. We recommend 4 GB of memory and a modern processor. A mouse is preferable to a touchpad for graphical editing.
Interested in other solutions?
Part of the SIMOGGA suite
Curious what your picking data would reveal?
Try SIMOGGA Analytics on a warehouse case, or ask us to run a first analysis with you.